Part 23 - ASM Debugging 1 [Moving Immediate Data]
For a complete table of contents of all the lessons please click below as it will give you a brief of each lesson in addition to the topics it will cover. https://github.com/mytechnotalent/Reverse-Engineering-Tutorial
Let’s begin by loading the binary into GDB.
To load into GDB type:
gdb -q moving_immediate_dat
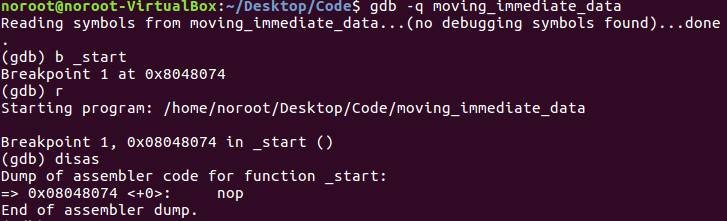
Let’s first set a breakpoint on start by typing b _start.
We can then run the program by typing r.
To then begin disassembly, we simply type disas.
We coded a nop which means no operation or 0x90 from an OPCODE perspective for proper debugging purposes which the breakpoint properly hit. This is good practice when creating assembly programs.
The native syntax as I have stated many times before is AT&T syntax which you see above. I painfully go back and forth deliberately so that you have comfort in each however going forward I will be sticking to the AT&T syntax however wanted to show you a few examples of both. I will state again that if you ever want to see Intel syntax simply type set-disassembly-flavor intel and you will have what you are looking for.
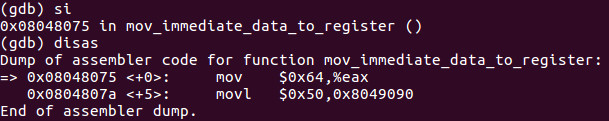
We first use the command si which means step-into to advance to the next instruction. What we see here at _start+0 is you are moving the hex value of 0x64 into EAX. This is simply moving decimal 100 or as the computer sees it, hex 0x64 into EAX which demonstrates moving an immediate value into a register.
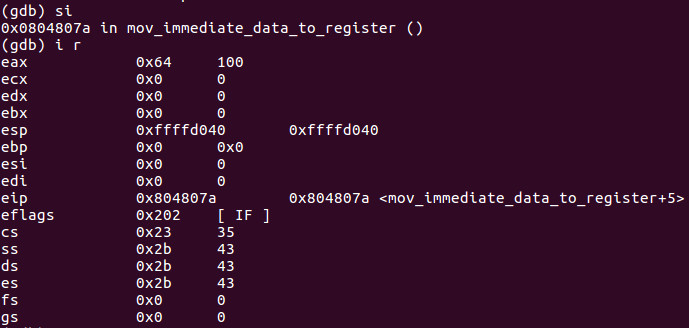
We step-into again and then use the command i r which keep in mind has a space between them to give us information on the state of the CPU registers. We can see EAX now has the value of 0x64 hex or 100 decimal.
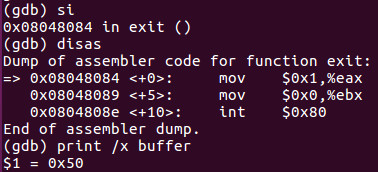
After we step-into again and do a disas, we see that we have then moved the value of 0x50 into the buffer label as can refer back to the source code from last week to see.
When dealing with non-register data, we can use the print command above as we type print /x buffer and it clearly shows us that the value inside buffer is 0x50. The /x designation means show us the value in hex.
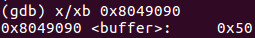
Consequently you can review slide 2 of this tutorial above you see at _start+5 the immediate value of 0x50 loaded into the buffer label or in this case the address of buffer which is 0x8049090 and we can examine it by using the examine instruction by typing x/xb 0x8049090 which shows us one hex byte at that location which yields 0x50.
We will be doing this with every program example so that we can dive into the debugging process. If there are any questions, please leave them below in the comments.
I look forward to seeing you all next week when we dive into creating our first assembly hack!